Monitoring RAID on Sophos UTM Hot-Standby Clusters with Dell PERC/LSI MegaRAID Controllers

This is a somewhat special post this time for a somewhat narrow audience but my intention was splitted into creating a reminder for myself and to show how you can even monitor things that are normally closed for manual configurations like the Sophos UTM and to generally show you how patience and the will to succeed can help you solve problems that appear to be hard to solve at all.
Problem description
So what's the problem with monitoring RAID-Systems at all? When you're using a Software-RAID like Linux RAID System you already using the same tools for setting up the RAID and monitoring them, like mdadm.
When using a Hardware-RAID like (in this example) the Dell PowerEdge RAID-Controller, or Dell PERC which is essentially a rebranded LSI MegaRAID Controller, you need a driver for it and tools to setup and monitor them. Most controllers can be configured after the BIOS POST using some kind of keystroke to get into the controller management "BIOS" to setup your hardware RAID and the disks and all kinds of parameters. When you're done you can just boot normally and install an OS on this RAID-Disk which appears to be a single disk for the OS, as long as your OS has a driver for the controller.
When you've installed the OS, you're mostly fine with it but you have to monitor it and therefore you need another tool. In case of the Dell PERC/LSI MegaRAID controllers (i'll call them "HWRAID" from now on) you want to use the megacli or the newer storcli tools to manage the controller and monitor it's health from the OS-layer.
On a standard Linux this is not a problem. You have to check which controller you have and choose the megacli or storcli version which supports it. Download it. Start it and you're done. You can even create a cronjob which calls the CLI tool and check the health and report back if it's critical.
On a closed system this is more a problem. We got the problem with two Dell PowerEdge R310 Servers both with a Dell PERC H700 Controller running Sophos UTM 9.409 as a Software-Appliance and in a Hot-Standby-Cluster where one Server is the Slave and cannot be reached from the network without workarounds.
How did we monitor the RAID before?
Until now we used Dell's iDRAC System (Dell Remote Access Controller) which provides an IPMI Interface to monitor the overall RAID health using the check_dell_raid.pl nagios check. This one returns something like Drive Present (good condition), Drive Present, Parity Check In Progress (RAID Rebuild) or something else (which is essentially RAID Critical) from the "Drive Slot / Bay" information slot.
While this is a good first indicator for monitoring, it's not accurate enough anymore for us. While we updated our UTM Cluster some days ago we saw that one disk was blinking orange from time to time, so we've contacted the very professional german Dell Pro Support on Twitter. They told us to send over the Logs from the controller using megacli.
In the end our problem was not a critical RAID but a failing disk which has Predictive Errors and can or will die more or less soon.
How did we got into the Hot-Standby (Slave) server to get the Logs?
This is the fun part. We had to solve two problems basically. The first one was: "How do we get into the slave/hot-standby server when it's not reachable from the network?" and the second: "How can we read the HWRAID controller logs in a closed system like the Sophos UTM?".
Let us solve it in those two steps.
Log into a Sophos UTM Hot-Standby Slave Server via SSH
As i said, the slave is not reachable from the network, so how do we get into the Slave via SSH?
Let me explain how the Sophos UTM Hot-Standby Cluster is setup in short. There is always a single master which handles everything and then there is a Slave Server which always has an active Hot-Standby link to the master. This is usually a dedicated network cable between both. In case of a failover the slave server already has the latest configuration and all logs, so it can take over as the new master within a ping.
Since there is a dedicated link between both, there is a network connection we can abuse for our needs.
At first, make sure that you've enabled SSH on your Cluster either with password or public key authentication. Log into the master first with ssh loginuser@<masterIpOrHostname>. From there run ip a to get all interfaces and their configured IP addresses.
Now check your HA-Configuration which network interface it uses to talk to the slave server. In our case it's eth4 and the actual master is node 2.
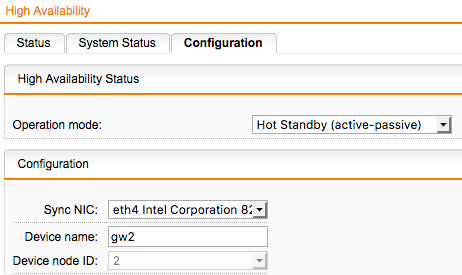
Now you can get the master's IP from the eth4 interface which in my example is 198.19.250.2. While we know that we're on node 2, the actual slave node with node id 1 must be 198.19.250.1. With this in mind we can now connect to the slave using a SSH Tunnel.
Simply connect to the master and create a tunnel to the slave node like this:
ssh loginuser@<masterIpOrHostname> -L 2222:198.19.250.1:22
We're now logging into the master and creating a tunnel from port 2222 on localhost to port 22 on the slave node. Now we can locally connect to the slave while the traffic is routed through the SSH tunnel:
ssh -p2222 loginuser@localhost
Congratulations. Now we're connected to the slave which you can acknowledge by identifying the prefix before the user@hostname part in the shell. It should show <S> loginuser@ip:/home/login >
Now to the monitoring part.
Use megacli/storcli to monitor the RAID on a slave
This can be a bit time consuming and tricky. At first you have to find a megacli/storcli version which supports your controller. In case of our PERC H700 this is megacli v8.07.14. Since getting an older megacli version can be tricky, i've uploaded it to my server too.
In the zip package there are several folders each for one OS. We need the Linux one. In there you can find the MegaCli-8.07.14-1.noarch.rpm file. Since Sophos UTM is based on Suse Linux Enterprise Server you could easily install the rpm on the server but installing third-party tools into the system is not allowed and could break your system for further updates. It is better to extract the needed files/binaries from the package, upload them to your home directory and run it with sudo from there.
You can unpack the rpm with rpm2cpio and cpio with the following command:
rpm2cpio MegaCli-8.07.14-1.noarch.rpm | cpio -idmv`.
It will extract the files to ./opt/MegaRAID/MegaCli/. There will be 3 files: libstorelibir-2.so.14.07-0, MegaCli and MegaCli64.
Now we will upload two of those files to the slave server using our ssh tunnel technique.
scp -P 2222 opt/MegaRAID/MegaCli/MegaCli loginuser@localhost:/home/login/
scp -P 2222 opt/MegaRAID/MegaCli/libstorelibir-2.so.14.07-0 loginuser@localhost:/home/login/
The former is needed by the binary to talk to the controller.
Now you can go to your slave ssh login window again and run the MegaCli binary and get information about the health of your HWRAID directly from the controller like this:
sudo ./MegaCli -AdpAllInfo -aAll
In the Output there will be a category called "Device Present" where you can see your virtual and physical disks and see if a physical disk is in a critical state like ours which has Predictive Errors. It looks like this on our RAID:
                Device Present
            ================
Virtual Drives    : 1
  Degraded        : 0
  Offline         : 0
Physical Devices  : 3
  Disks           : 2
  Critical Disks  : 1 <--- These are "failing" disks
  Failed Disks    : 0 <--- These are "dead" disks
When you run MegaCli with -PDList -aALL you will get more information about each physical disk and you can see how much Predictive Errors it has. It looks like this:
Enclosure Device ID: 32
Slot Number: 1
Drive's position: DiskGroup: 0, Span: 0, Arm: 1
Enclosure position: N/A
Device Id: 1
WWN: <redacted>
Sequence Number: 2
Media Error Count: 0
Other Error Count: 36
Predictive Failure Count: 16 <--- Should be 0 on healthy disks!
Last Predictive Failure Event Seq Number: 2171
PD Type: SAS
Bonus: Change a defective disk on the slave
You can also manage your HWRAID with megacli like taking the affected drive offline, change it physically and bring it back online.
You can identify the affected disk by it's Enclosure Device ID: and the Slot Number:. In our case it's 32 and 1.
Taking the disk offline is as easy as:
sudo ./MegaCli -PDOffline -PhysDrv [32:1] -a0
where -a0 is the first HWRAID controller in your system. It will always be 0 assuming that you only use a single HWRAID controller. You can see all of your controllers with the -AdpAllInfo -aAll command from above.
The next 2 steps will mark this specific drive as missing and will do a spin-down for the physical drive removal.
sudo ./MegaCli -PDMarkMissing -PhysDrv [32:1] -a0
sudo ./MegaCli -PDPrpRmv -PhysDrv [32:1] -a0
After it has been brought down, you can replace the physical disk. The Rebuild should start automatically when a factory new disk has been inserted. In case it's not you can bring it back online with:
sudo ./MegaCli -PDOnline -PhysDrv [32:1] -a0
If you insert a disk which has been used already on other RAID configurations, you have to erase that config first from the disk itself using megacli.
Conclusion
That's it. You can see it's not that hard to get good monitoring and RAID management even on barely open systems. You can use the above tools and methods also on other systems which have similar problems and of course also on ordinary Linux systems with such HWRAID controllers.
A small disclaimer: I'll not take any responsability for running the above commands on your production systems!